Titanic Data Analysis & Visualization
Quick Answer
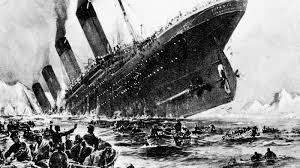
Description
This project provides a comprehensive Data Science deep-dive into the Titanic passenger dataset. Moving beyond simple correlation checks, it utilizes advanced feature engineering, interactive visualizations (Seaborn, Plotly), and predictive machine learning models to identify the underlying socio-economic and demographic factors that influenced survival rates. By analyzing missing data patterns (like the missing Cabin and Age values), the project demonstrates a robust pipeline for data cleaning and statistical inference.
Problem Statement
- Data Inconsistency: The Titanic dataset contains significant missing values and noise, requiring careful imputation to avoid model bias.
- Feature Interaction: Simple factors like "Class" or "Gender" interact in complex ways (e.g., the "Women and Children First" policy). These interactions must be mathematically modeled to truly understand survival probabilities.
- Static Reporting: Standard table-based reports are difficult to interpret for identifying trends in passenger demographics.
Solution
Phase 1: Exploratory Data Analysis (EDA)
Performed extensive EDA using Seaborn and Plotly to visualize the distribution of ages, fares, and cabin classes. Identified a strong correlation between P-class (Ticket Class) and survival, necessitating further investigation into socio-economic shielding during the disaster.
Phase 2: Imputation and Feature Engineering
Rather than deleting rows with missing data, the project applies mean/median imputation and creates new features, such as "Family Size" (combining SibSp and Parch) and "Title" (extracted from names), to capture latent social status.
Phase 3: Predictive Modeling
Built and compared several machine learning models (Logistic Regression, Random Forest, Decision Trees). Evaluated models using confusion matrices and ROC-AUC curves to ensure high predictive power across both the survivors and non-survivors.
Conclusion
The Titanic Analysis demonstrates the power of structured data science in uncovering historical narratives. By moving from raw numbers to predictive insights, the project provides a reusable framework for analyzing any discrete dataset involving demographic survival or classification.
Other Use Cases
- Insurance Risk Assessment: Predicting the likelihood of claims based on demographic and historical data to optimize premium pricing.
- Retail Churn Prediction: Identifying which customer segments are most likely to leave a service based on their interaction history and demographics.
- Public Health Analytics: Analyzing survival rates across different demographics during outbreaks to identify vulnerable populations.
- Credit Scoring: Building models to predict loan default probability based on socio-economic features similar to the Titanic's classification factors.
- Employee Retention Analysis: Identifying factors that correlate with employee turnover within large organizations.
Tech Stack
Developed Over
2024 - Present
Category
Data Science
About the Author

Durvesh Baharwal
Full Stack AI Engineer & Data Scientist- Full Stack AI Engineer @ AI Alpha Tech
- Research Associate · ISRO / SAC
- NASA Space Apps Participant
- B.E. AI & Data Science, MET BKC Engineering
Durvesh builds production-grade AI systems ranging from satellite navigation algorithms to computer vision pipelines. He bridges deep research with practical deployment across industries.